![]()

This was just a fun Jupyter Notebook that I played around with while procrastinating on my chemistry research. While trying to find a video of when Professor Oliver Knill created a Miley Cyrus Wrecking Ball animation in Mathematica to show some friends, I stumbled across his Mathematics in Movies page on his website, and his quick nod to Annihilation and the iterated function system-like animation during the end credits. This sent me down a rabbit hole of finding fractal-generating software, and I figured I would try to generate some rudimentary fractals of my own in the language I know best: Python!
I vaguely remembered this awesome Doodling in Math Class video on binary trees that I had seen back in high school and thought that would be cool thing to implement in code.
The Sierpiński triangle
As mentioned in the Doodling in Math Class video, drawing a binary tree with consistent horizontal and vertical spacing for branches, and in which the branches that meet have no children, is one method of constructing the Sierpiński triangle. The Wikipedia page also details some other pretty cool constructions and is worth a look! Using the binary tree construction, however, adds the cool element of practicing and animating! some basic tree traversal algorithms.
Accessing the Notebook
On Your laptop
First, set up a virtual environment to run the notebook. I have tested this Notebook using python 3.7, but it will probably work with 3.5 or newer.
Using virtualenv and pip I have frozen my working environment in full_env.txt, so the environment can be recreated with
pip install -r full_env.txt
in your virtualenv to get the necessary dependencies. The weird name for the requirements is to avoid conflicts with building the notebook environment on Binder. In order to display animations in the notebook, however, you will also need to make sure that ffmpeg is installed on your machine.
Using conda
Alternatively, environment.yml can be used to create a conda environment that includes
ffmpeg. This is used for building the notebook on Binder. If you
are a conda user, then, just run
conda env create -f environment.yml
Now you can explore the notebook by running
jupyter notebook
and then clicking on Sierpinski_Triangle.ipynb in the navigator.
On Binder
As mentioned earlier, a fully interactive version of the notebook is also available on Binder. Binder builds a Docker container containing a conda environment with all of the dependencies and allows you to run and change the notebook interactively without needing to install anything on your own machine!
Some Examples
Create a tree
root = Node([0, 0])  # creates a node at the origin
root.left = Node([-1, -1], parent=root)  # Add children
root.right = Node([1, -1], parent=root)
Display the Tree
fig = plt.figure(figsize=(6,6))  # set up the figure
ax = fig.add_subplot(111)
for node in bfs(root):           # traverse and draw the tree
    node.draw()
plt.axis('off')
plt.axis('equal')
plt.show()
This should display the following simple tree:

Create Tree with Integer Values
Nodes need not strictly have values of Cartesian coordinates, but as of now, this is the only way to plot them. Here is an example, though, where the nodes have numerical values, and the tree can still be searched and values printed in a specified order. Specifying the parents of these nodes is not necessary, since parents are only used in plotting the tree.
We will build the following tree, where the text shows the values associated with each node.
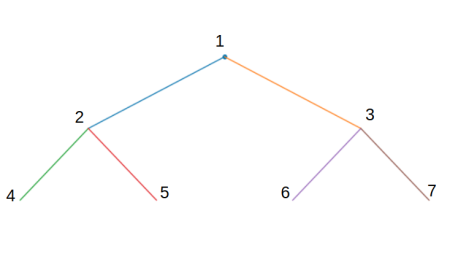
root = Node(1)  # creates a node at the origin
l1 = Node(2)  # Add children
r1 = Node(3)
ll2 = Node(4)
lr2 = Node(5)
rl2 = Node(6)
rr2 = Node(7)
root.left, root.right = l1, r1
l1.left, l1.right = ll2, lr2
r1.left, r1.right = rl2, rr2

vals = []
for node in bfs(root):
    vals.append(node.val)
print(vals)
>>> [1, 2, 3, 4, 5, 6, 7]
Changing bfs above to another search algorithm will alter the order in which
node values are printed.
Build a Sierpinski Triangle
To build the special Sierpinski tree, instantiate an object of type Tree and then add some levels, or layers, to it.
fig = plt.figure(figsize=(6,6))  # set up the figure
ax = fig.add_subplot(111)
tree = Tree(Node([0,0]), dx=1, dy=1, ax=ax)  # dx and dy determine branch dimensions
tree.add_layers(3, plot=True)   # grow the tree
plt.axis('off')
plt.axis('equal')
plt.show()
This should output

Animate the Drawing of a Tree
So far this is only implemented for the actual Tree class and not for arbitrary binary trees.
from IPython.display import HTML

tree = Tree(Node([0,0]), dx=1, dy=1)  # initiate a tree with an origin at 0,0
tree.add_layers(15)  # grow the tree by adding 15 layers
anim = animate_sierpinsky(tree, order=dfs, N=3, interval=20, save_count=10**4)  # animate the drawing

HTML(anim.to_html5_video())  # display the video in notebook
The resulting video will display the construction of the fractal in the order dictated by a depth-first search, as seen below.
We can alternatively change the order parameter in animate_sierpinsky to use other search methods, including a
breadth-first search, seen here.
Who said computer science couldn’t be fun!?